
Is Life Insurance a Good Asset?
Many arguments have been presented regarding the inclusion of life insurance as an asset class in a long-term investment portfolio. However, none have been more convincingly expressed than those by Christian Kaplan, CFA, from Equitable. This article is inspired by Mr. Kaplan’s thought leadership and while his detailed explanations can get quite complicated, we have attempted to make this as simple as possible.
The Real Question
As insurance advisors, we run hundreds of life insurance illustrations every week, and we are frequently asked: “What is the policy Internal Rate of Return?” – meaning, the return of the amount invested in premiums (negative cash flows) to the eventual death benefit received (positive cash flows).
 It is a logical question but what we are really being asked is: “Is life insurance a good investment?” Generally, our response is dependent upon the answers to two additional questions:
- A “good investment” compared to what; and
- when is the insured expected to die?
The Internal Rate of Return page of a life insurance illustration looks something like the following with the blue line (age 84) indicating the life expectancy:
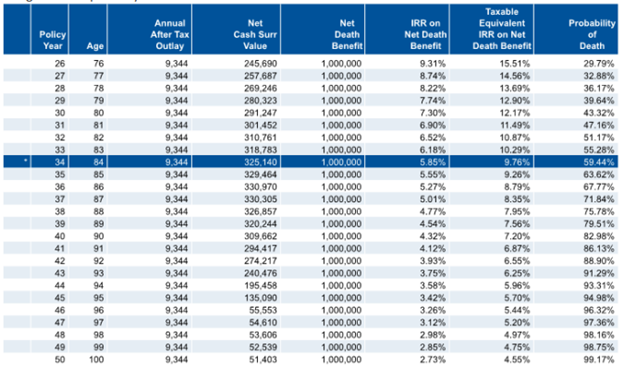
The answer to the question “Is life insurance a good investment?” is “maybe.” In the above example, the IRR on net death benefit is 5.85%. This is based on annual premiums of $9,344 on a Male age 50 at Standard Plus Non-Tobacco rates and a death benefit of $1,000,000 received at age 84, which is the calculated Life Expectancy using the Society of Actuaries Valuation Basic Table (VBT) from 2008. The problem with this answer is that “Life Expectancy” (the average period that a person may expect to live) simply means that 50% of the people will die before age 84 and 50% of the people will die after 84. The reason for saying “maybe” is obvious. The insured could die sooner or later and when death occurs will change the cash flows and, by consequence, the Internal Rate of Return.

Analysis to Answer the Question
To have a better sense of the true value of life insurance as an asset class, Mr. Kaplan argues that one must dive into some complicated statistical analysis, which I will spare you in this article. In summary however, one must calculate the “Expected Rate of Return” which considers the likelihood of the insured passing away before or after LE. To do that, a mathematic calculation needs to occur around the probability of mortality and its impact on the standard deviation of returns. Statistics tell you that 68.2% of all data points lie plus or minus 1 standard deviation from the mean as reflected in the bell curve below.
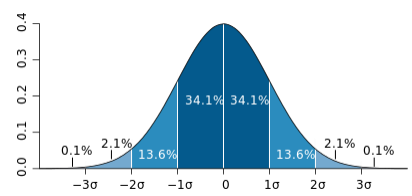
If you apply this logic to a mortality curve (life expectancy) this means that 68.2% of people will die (in our example) between the ages of 74 and 94. Further math determines that the arithmetic mean of the returns during that period is 6.08% with a standard deviation from the mean at 1.89%. Therefore, we can comfortably conclude, that there is a high probability, greater than two-thirds, that the returns will be between 4.19% and 7.97%.
Please note this analysis does not factor in policy return variations (our example uses an IUL run at 5%), carrier default risk, or policy cost changes of carrier product. With that said, it is important to note that with a guarantee provision in a contract and use of a highly rated carrier, much of this risk is reduced dramatically. So now we return to the original question, “is life insurance a good investment?” and again we ask, “compared to what?”
Uncorrelated to Other Capital Markets
Life insurance proceeds are completely uncorrelated to other capital markets, 100% liquid for face value, and paid in cash at the time of death. Furthermore, life insurance proceeds are income tax free, which means that in a 40% income tax rate, the returns expectation – 68.2% of the time in our example – would be between 6.98% and 13.28%. Given that, this seems like a very attractive asset class.

Sharpe Ratio & Life Insurance
Portfolio managers, however, would prefer to get into a discussion of expected portfolio returns, risk free rates and portfolio standard deviations to calculate a Sharpe Ratio and then compare life insurance to other asset classes such as stocks and bonds or a portfolio of a mix of stocks and bonds. The Sharpe Ratio is a measure of the risk-adjusted return and has become the industry standard for this calculation. The Sharpe Ratio, developed by Nobel laureate William F. Sharpe, is the average return earned in excess of the risk-free rate per unit of volatility or total risk. The higher the Sharpe Ratio, the more attractive the risk-adjusted return.
So, let’s assume we are now speaking with portfolio managers and talk about the Sharpe Ratio and life insurance. If we assume that the Expected Rate of Return (after taxes) at Life Expectancy is 5.85% (as per the illustration provided) and that the Risk-Free Rate as measured by the 10-Year Treasury is 2.4%, using the standard deviation previously calculated (1.89%), the Sharpe Ratio of Life Insurance is 1.82. By comparison, the proxy for the stock market is the SPY (SPDR S&P 500 ETF) which has a Sharpe Ratio of .51 and the proxy for the bond market is the LQD (iShares IBoxx $ Inv Grade Corp Bonds) which has a Sharpe Ratio of .68. Now let’s bring this statistics and finance class to closure. What does all this mean? How is the Sharpe Ratio affected in scenarios that do and do not include life insurance? Consider a client with the following two asset allocation options:
- A portfolio of 70% stocks and 30% bonds; and
- A portfolio of 50% stocks, 25% bonds and 25% permanent life insurance.

The estimated Sharpe Ratio for Portfolio 1 is .56 versus Portfolio 2 which is .88. Portfolio 2 has a markedly improved Sharpe Ratio – 57% higher. By including life insurance as an asset class in the portfolio, the investment manager NOW has a means to improve risk-adjusted returns!
For the client interested in managing an investment portfolio for wealth transfer purposes and with an appropriate time horizon, life insurance should have a seat at the portfolio management table as an asset class.
")

